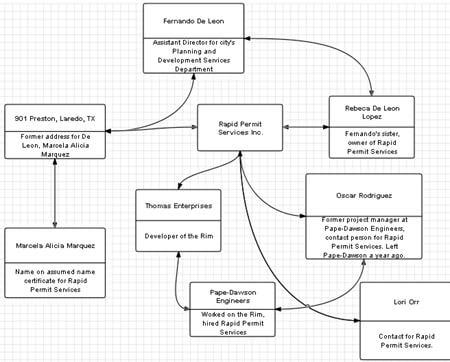
When City Hall reporter Josh Baugh and I worked on this story about fired city official Fernando De León, Josh found a nice online tool to help us connect the dots.
LucidChart lets you create flow charts and organizational trees that you can share with your colleagues and publish when you’re done. Here’s the chart we made for our most recent story.
Related: Could a blog win a Pulitzer prize?
It’s a quick and easy tool featured on Lifehacker. Our chart helped me explain to graphic artist Mike Fisher what our story was about visually, which resulted in a simplified version that ran in the paper.
Thankfully, our chart wasn’t as complicated as this bad boy.


John,
This is really cool. I think this kind of social-network analysis is a new frontier for journalists. I tried to use a program called UciNet a few years ago for this kind of thing — plotting the relationships between political figures in Tennessee, when I worked there — but I never could get it to work well. But the lady who is the training director for IRE did some whiz-bang stuff with it that she displayed at the IRE conference and, I think, wrote her master’s thesis on the use of social-network analysis for journalists. I’ve been fooling for about a year now with a program called Analysts Notebook, too, that’s really cool but awfully expensive.
Hey, thanks for the mention! LucidChart was always designed to be the very easiest diagramming tool imaginable, and I’m glad you found it that way :-)
Ben Dilts
Founder, LucidChart